Latest e-learning Statistics 2025
Discover essential insights and up-to-date statistics on the evolving eLearning landscape.
The global eLearning market is expected to hit $203.81 billion in 2025, and it’s just getting started. With 1.1 billion users forecasted by 2029, and an average revenue per user of $218.77, online education is seeing explosive global demand.
The U.S. alone is set to generate nearly $100 billion in revenue this year. India is growing even faster, with a CAGR of 25.76%.
Additionally, the use of AI-powered subtitles and mobile learning is increasing productivity by 43%.
I analyzed over 40+ stats to show how digital learning is evolving. Let’s explore what makes eLearning 2025’s biggest educational revolution.
eLearning Statistics 2025: In a Snap
- The global eLearning market is projected to reach $203.81 billion in 2025 and grow to $279.30 billion by 2029.
- U.S. will generate nearly 49% of global eLearning revenue in 2025, totaling $99.84 billion.
- India’s eLearning market will reach $7.57 billion in 2025, growing at a 25.76% CAGR (the highest worldwide).
- The number of eLearning users is expected to surpass 1.12 billion worldwide by 2029.
- Mobile Learning boosts productivity by 43%, with employees completing training 45% faster and retaining 45% more information than desktop users.
- 93% of businesses will adopt eLearning in 2025 to boost engagement, performance, and ROI.
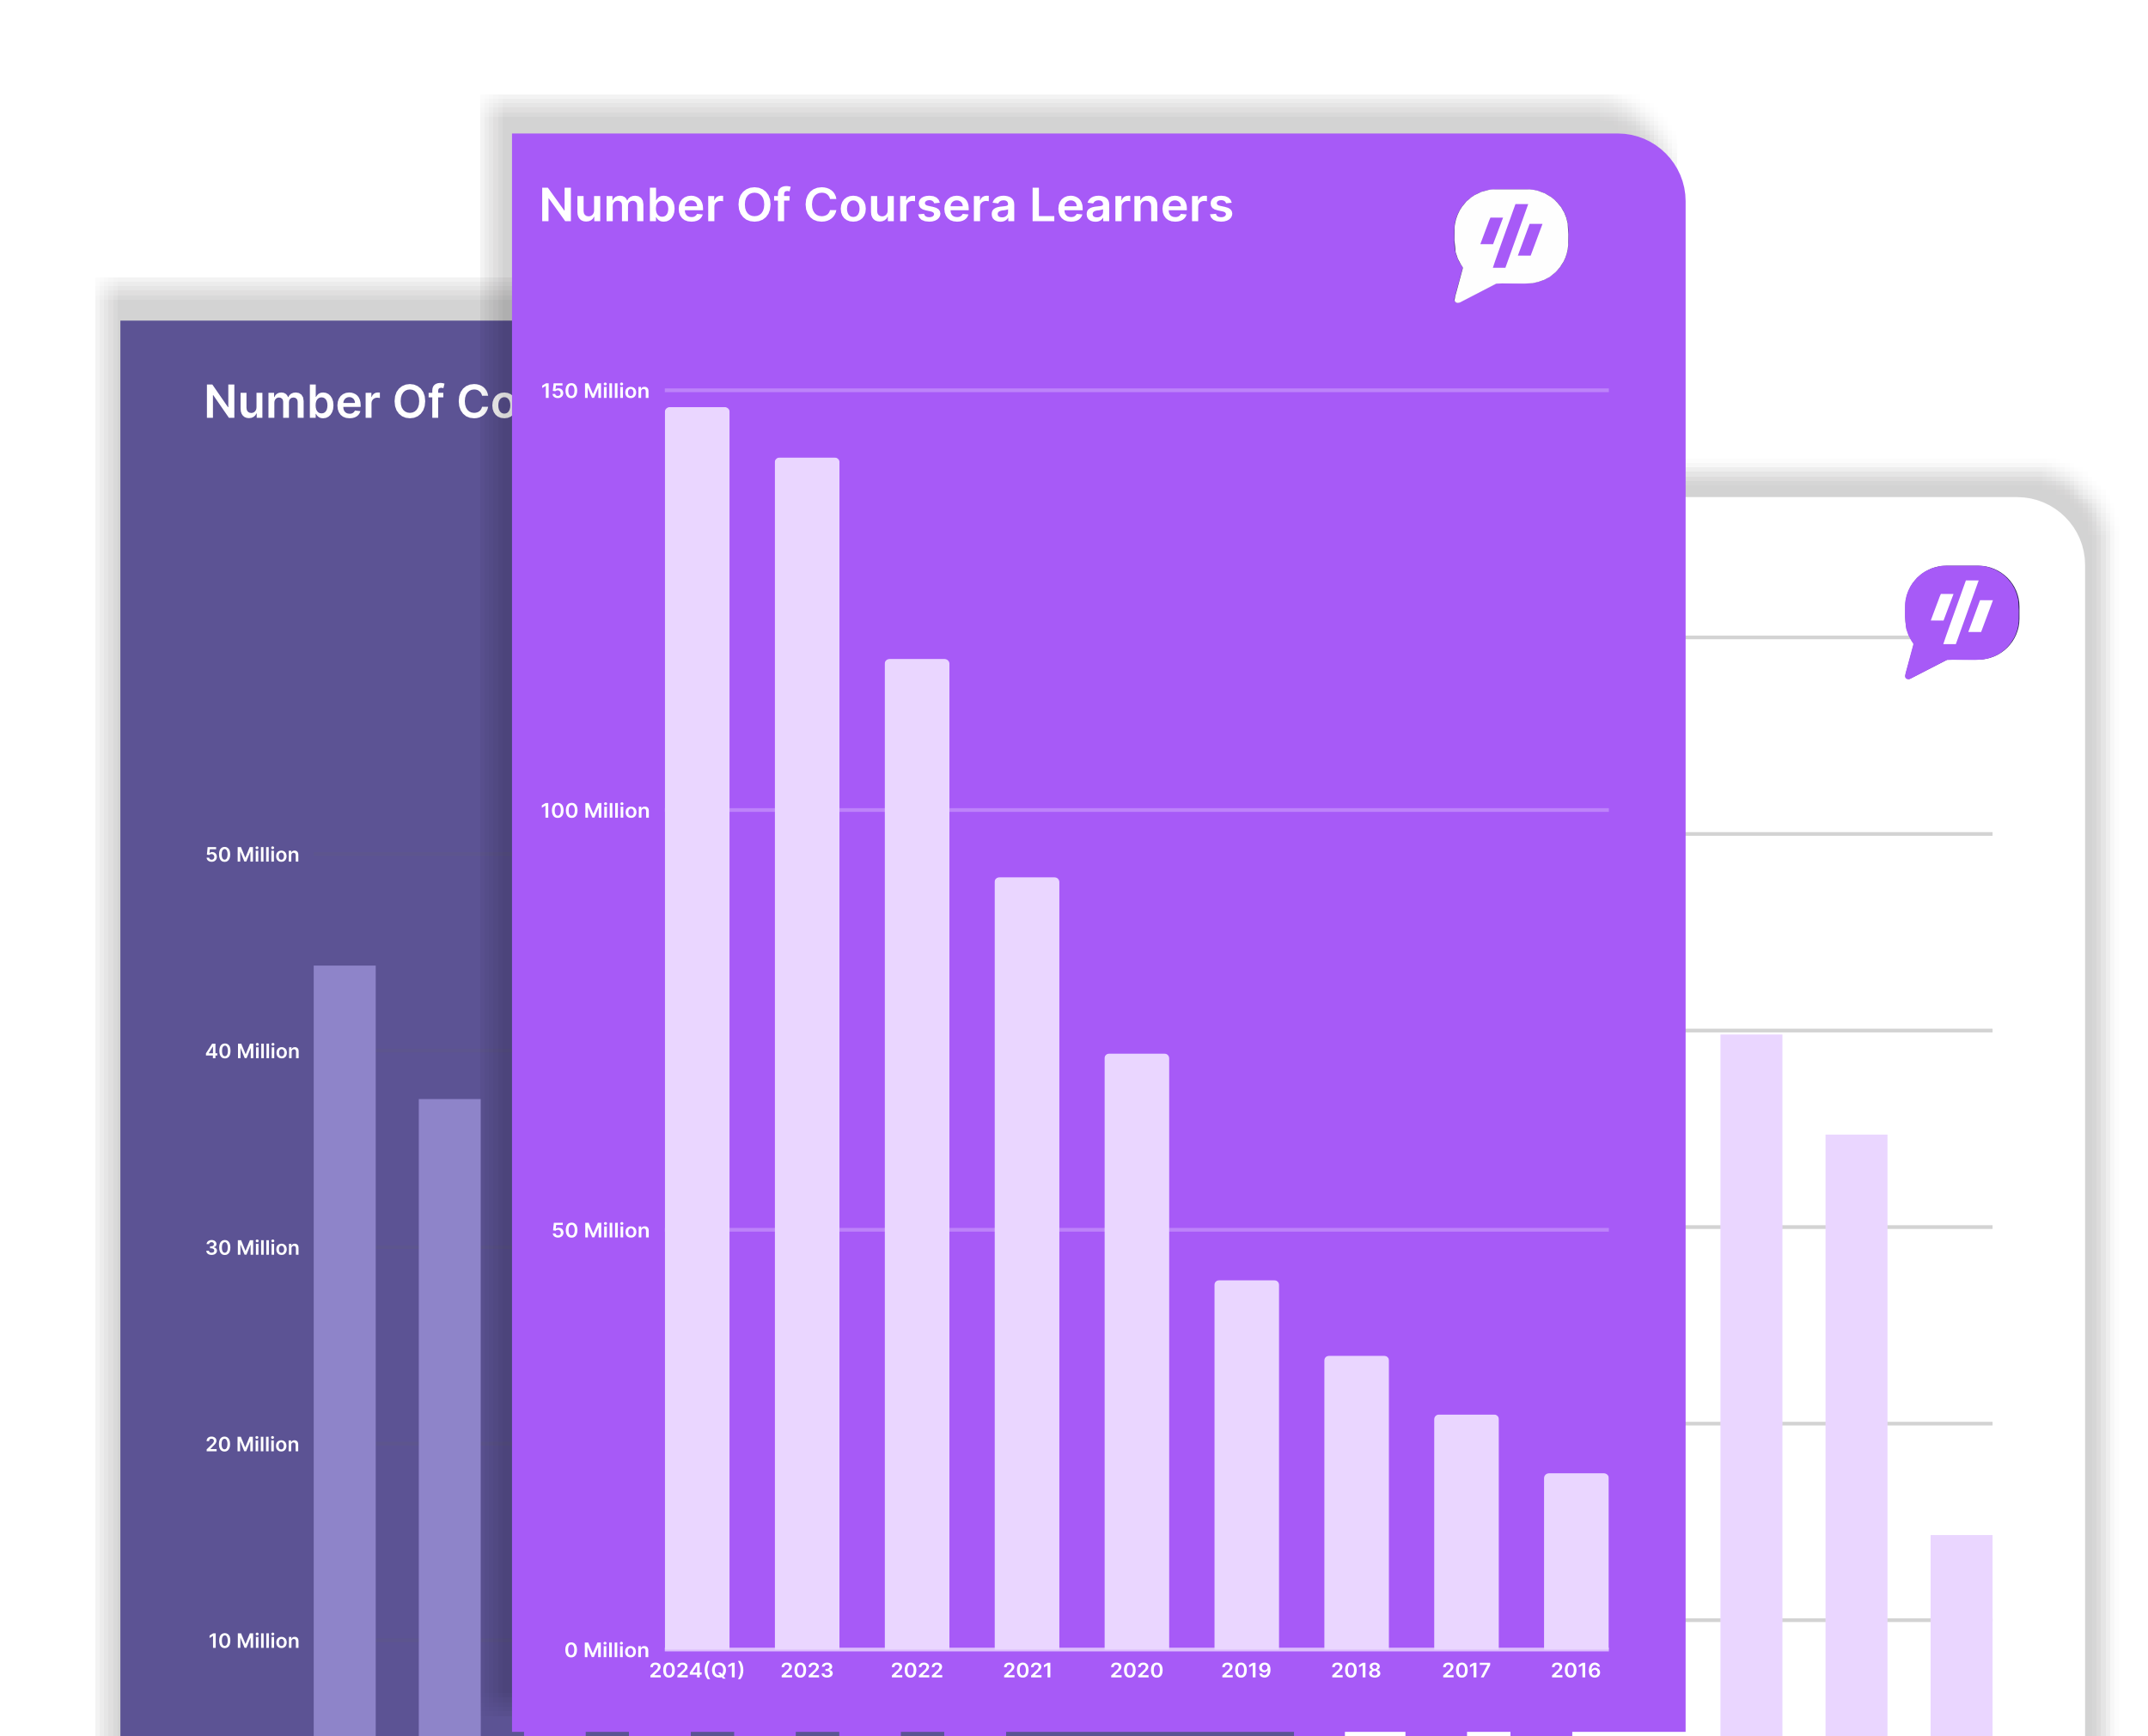
- Coursera added 7 million users in one quarter, growing from 142M to 148M globally.
eLearning Market Size Statistics
1. In 2025, the online education market is expected to reach $203.81 billion.
The market is expected to grow at a CAGR of 8.20% between 2025 and 2029. Hence, by 2029, the online learning market is expected to be valued at $279.30.
In 2025, the majority of the market’s revenue is expected to be generated in the United States, at $99.84 billion.
The online learning market’s average revenue per user is predicted to amount to $218.77 in 2025, and the number of users is anticipated to reach 1,121 million by 2029.
The online learning industry has experienced significant growth in overall market size over the past decade. In 2014, the industry was valued at around $ 165 billion. By 2022, it had expanded to $ 240 billion.
This nearly 100 billion dollar jump in just eight years shows how rapidly the sector is scaling.
Source: Statista, Delvin Peck
Growth of eLearning
2. The eLearning industry grew by 900% between 2000 and 2020.
The global eLearning market is expected to grow at a CAGR of 9.1%, reaching unprecedented heights by 2026.
The COVID-19 pandemic fueled exponential adoption. Projections show over 200% growth in just five years.
The global e-learning market is projected to reach $370 billion by 2026.
The number of individuals taking online courses is expected to reach 57 million by the year 2027.
Source: Delvin Peck.
eLearning Statistics by Country
3. By end of 2025, the revenue in the online education market in the United States is predicted to reach $99.84 billion.
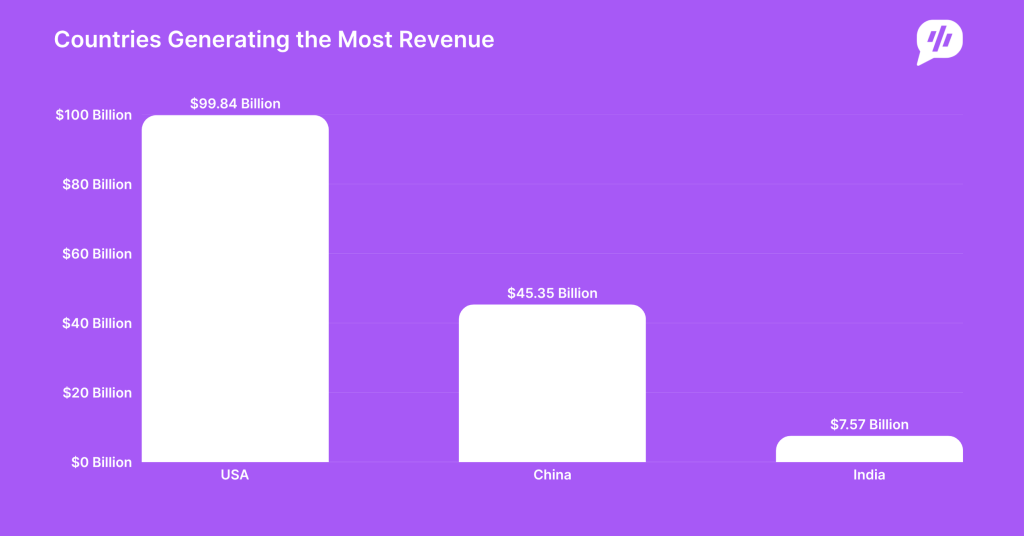
The revenue is expected to grow at an annual rate of 9.64%. As a result, the revenue of the online education market in the United States is predicted to reach $144.29 billion by the end of 2029.
On average, the revenue per user in the online education market is expected to reach $1,490 in 2025. At the same time, the number of online learners in the United States is anticipated to reach 87.6 million users by the end of 2029.
User penetration in the online education market in the USA is expected to reach 19.5% by the end of 2025.
Source: Statista
4. The revenue of the online education market in China is estimated to reach $45.35 billion in 2025.
After the United States, the eLearning market is recorded to be the largest in China.
The revenue of the market is expected to grow at a rate of 0.03% between 2025 and 2029, resulting in a market volume of $45.40 billion by 2029.
The average revenue per user in the online education market in China is expected to amount to $140.90 in 2025.
Source: Statista
5. The e-learning market revenue in India is expected to reach $7.57 billion by the end of 2025.
The market revenue is expected to reach $18.94 billion by 2029 after growing at a CAGR of 25.76%.
Besides, the online learning platform market in India is projected to reach a market volume of $6.20 billion in 2025.
The average revenue per user of the online education market in India is expected to reach $34.62 in 2025, while the average number of online learners in the country is expected to reach 309.1 million by 2029.
In India, user penetration within the online education market is projected to reach 15.0% by the year 2025.
Source: Staista
6. The eLearning market in the United States is forecasted to reach $10.60 billion in 2024.
The e-learning market revenue in the United Kingdom is expected to grow annually at a compound rate of $14.6 billion by 2028.
Besides, the average revenue per user is expected to reach $0.89k in 2024. Further, by the end of 2028, online education users are expected to reach 15.1 million by the end of 2028.
In the United States, the online learning industry had reached a value of 100 billion dollars in 2022, making it the largest online education market in the world.
By 2030, experts estimate that this figure will climb to nearly 687 billion dollars.
China ranks as the second-largest market for online learning. It is expected to reach a market value of $171 billion by 2030, highlighting its growing influence in the global education sector.
Source: Statista, Delvin Peck.
Adoption of AI in eLearning
7. The AI in education market size is currently growing at a CAGR of 17.2% and is expected to reach $ 5.02 billion by 2033.
According to the latest 2025 research, the AI-powered e-learning subtitle generation market reached a value of 1.34 billion dollars in 2024, showing strong momentum in the global education technology sector.
Regionally, North America holds the largest market share as of 2024, thanks to its mature digital education infrastructure and high adoption of AI tools. The United States leads the region, with Europe and the Asia Pacific following closely behind.
However, Asia Pacific is projected to witness the fastest growth in the coming years, fueled by increasing internet access, rapid digitalization, and government-led education reforms.
Source: Data Intelo
8. 26% of U.S. students now use ChatGPT for schoolwork, nearly double the 13% in 2023.
As of 2025, 56% of teens highly familiar with ChatGPT report using it for schoolwork.
Despite this increase, 73% of teens still do not use ChatGPT for their studies.
Moreover, 54% of students believe it is acceptable to utilize ChatGPT for researching new topics.
However, these opinions vary depending on the subject. The following tables outline their perspectives:
| Task | % Who Say it’s Acceptable | % Who Say it’s Unacceptable | % Who Are Unsure (Implied) |
|---|---|---|---|
| Researching new topics | 54% | 9% | 37% |
| Solving math problems | 29% | 28% | 43% |
| Writing essays | 18% | 42% | 40% |
Source: Pew Research
9. 3 in 5 educators have adopted the usage of AI in their classrooms.
With the increased adoption of AI worldwide and in the United States, 60% of educators have adopted AI in the classroom.
The majority of educators who have adopted AI in their classrooms have done so to personalize the student’s learning process.
The survey found that younger teachers under 26 are more likely to adopt AI tools.
Source: Forbes.
AI could reduce teachers’ average 11 hours of weekly preparation time down to 6 hours by handling low-level administrative tasks.
Source: ED Gov
10. 51% of the teachers stated that they had used AI-powered educational games to engage students in the learning process.
At the same time, 43% of the teachers stated that they had utilized adaptive learning platforms to help students with the learning process, while 35% of teachers stated that they used chatbots for student support.
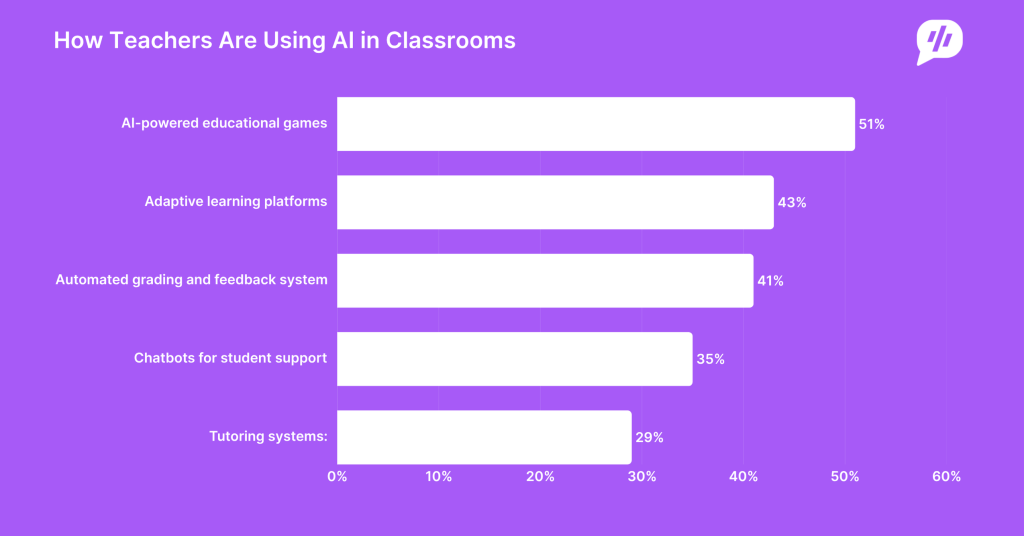
Here is a table displaying the percentage of teachers that utilize different AI technologies to make learning interactive and easier:
| Usage of AI | Percentage of teachers |
|---|---|
| AI-powered educational games | 51% |
| Adaptive learning platforms | 43% |
| Automated grading and feedback system | 41% |
| Chatbots for student support | 35% |
| Intelligent tutoring systems | 29% |
| Other | 5% |
| No AI-based tools used | 6% |
| Not sure | 3% |
Source: Forbes.
AI in eLearning Usage by Demographics
Black and Hispanic students, comprising 31% each, are more likely than their White counterparts, at 22%, to utilize ChatGPT for academic purposes.
In 2023, usage was similar across races, around 11–13%, showing a sharp rise in 2024 among Black and Hispanic students.
83% of White teens are more likely to have heard about ChatGPT compared to 73% of Black teens and 74% of Hispanic teens.
However, Older students use ChatGPT more. Here are the numbers:
| Grade Level | Students Using ChatGPT (%) |
|---|---|
| 11th–12th graders | 31% |
| 9th–10th graders | 25% |
| 7th–8th graders | 20% |
Source: Pew Research
Academic eLearning Statistics
11. 73% of the students want to take online courses even after the pandemic.
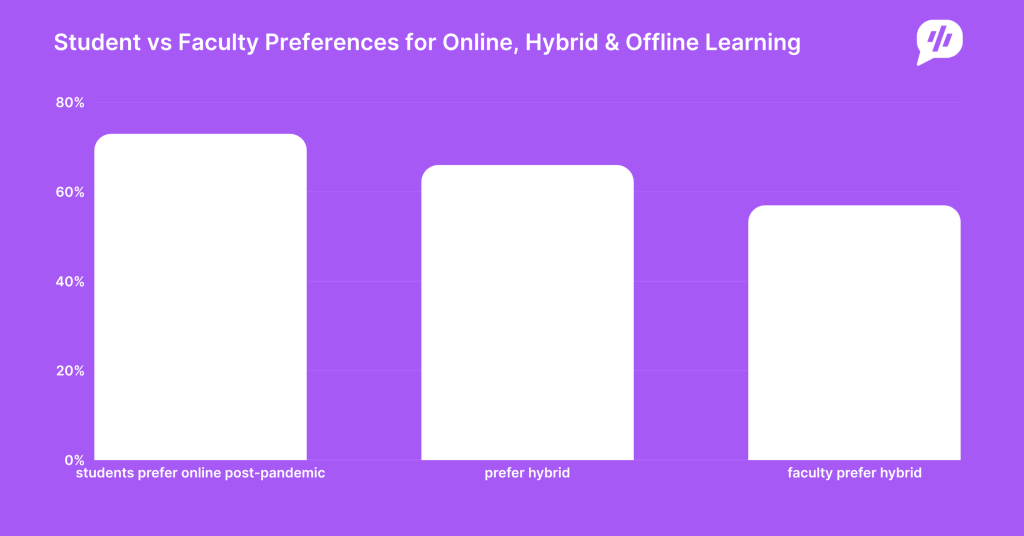
Post-pandemic, three-quarters of the students wanted to continue their classes online. However, only half of the faculty, that is, 53% of teachers, felt the same about teaching online.
At the same time, 66% of the students favored combining in-person and online courses. Meanwhile, 57% of the faculty said they preferred to teach in hybrid mode.
Source: Campus Technology.
12. 54.4% of undergraduates and 53.5% of the graduate students reported opting for distance education courses in fall 2023.
Undergraduate students are more likely to choose a hybrid option. 23.9% of the undergraduates were enrolled in exclusively online courses, while 30.5% were enrolled in both online and offline courses.
Conversely, 38.7% of the graduate-level students were enrolled in fully online courses, while 14.8% took classes in a hybrid format.
Source: Forbes.
13. 65% of the female students and 31% of the male students were enrolled in online classes as of 2024.
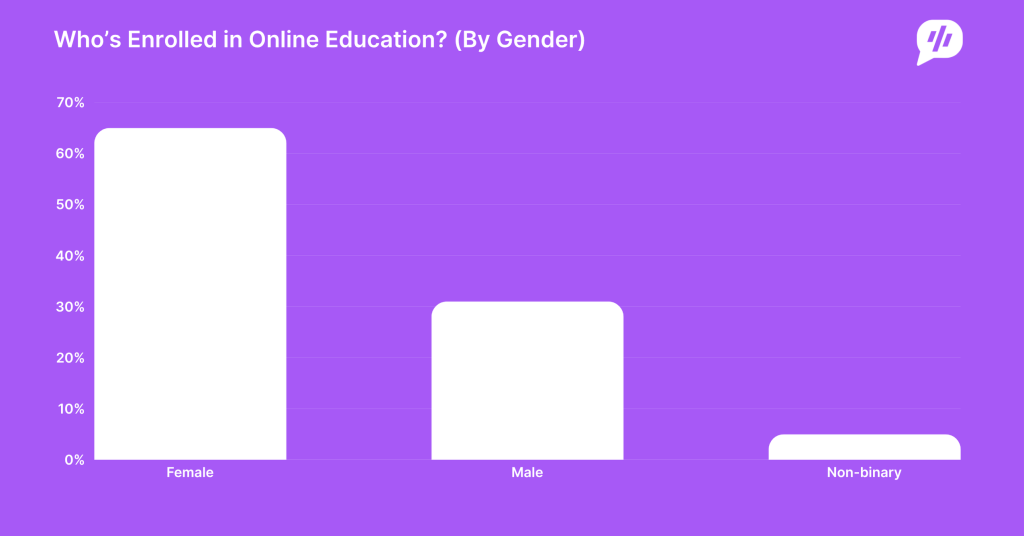
The majority of the students studying online were female, while just one-third of the online learners were male.
On the other hand, 5% of the students enrolled in online education were Non-binary/non-conforming.
Source: Consumer Affairs
White students dominate online college enrollment, representing 72% of all students in digital learning programs.
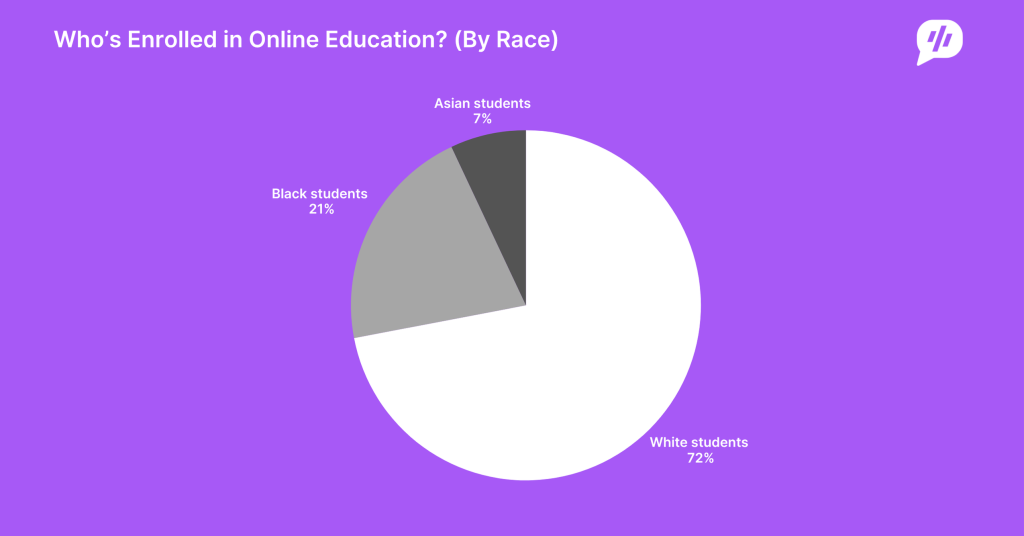
Here’s the racial and ethnic composition of online college enrollment presented in a table:
| Racial and Ethnic Group | % of Online College Enrollment |
|---|---|
| White students | 72% |
| Black or African American students | 21% |
| Asian students | 7% |
| American Indian or Alaska Native students | 4% |
| Students selecting “Other” | 3% |
| Native Hawaiian or Other Pacific Islander students | 1% |
Source: Consumer Affairs
14. 21% of the business undergraduates and 23% of the business graduates studied in online college.
The majority of the students enrolled in online colleges studied business. Conversely, a small number of online students were enrolled in counseling and human services.
Besides, a good number of online students were recorded as having enrolled in health, nursing, and medicine, as well as in computers and IT fields.
The following table displays the leading fields of study for online college students in the United States as of 2023 by level of education.
| Field of study | Undergraduates | Graduates |
|---|---|---|
| Business | 21% | 23% |
| Health, nursing, & medicine | 20% | 19% |
| Computers & IT | 16% | 19% |
| Arts & Humanities | 11% | 9% |
| Science, Technology, Engineering, or Mathematics | 10% | 6% |
| Social Sciences, Criminal Justice, Law | 10% | 6% |
| Education & Teaching | 7% | 1% |
| Counseling, Human Services | 5% | 6% |
Source: Statista.
15. 63% of the K-12 teachers in the United States said that they think ed-tech or education technology majorly impacts self-paced learning.
Meanwhile, 27% of the teachers in the United States said that edtech or education technology majorly impacts Expanded course offerings.
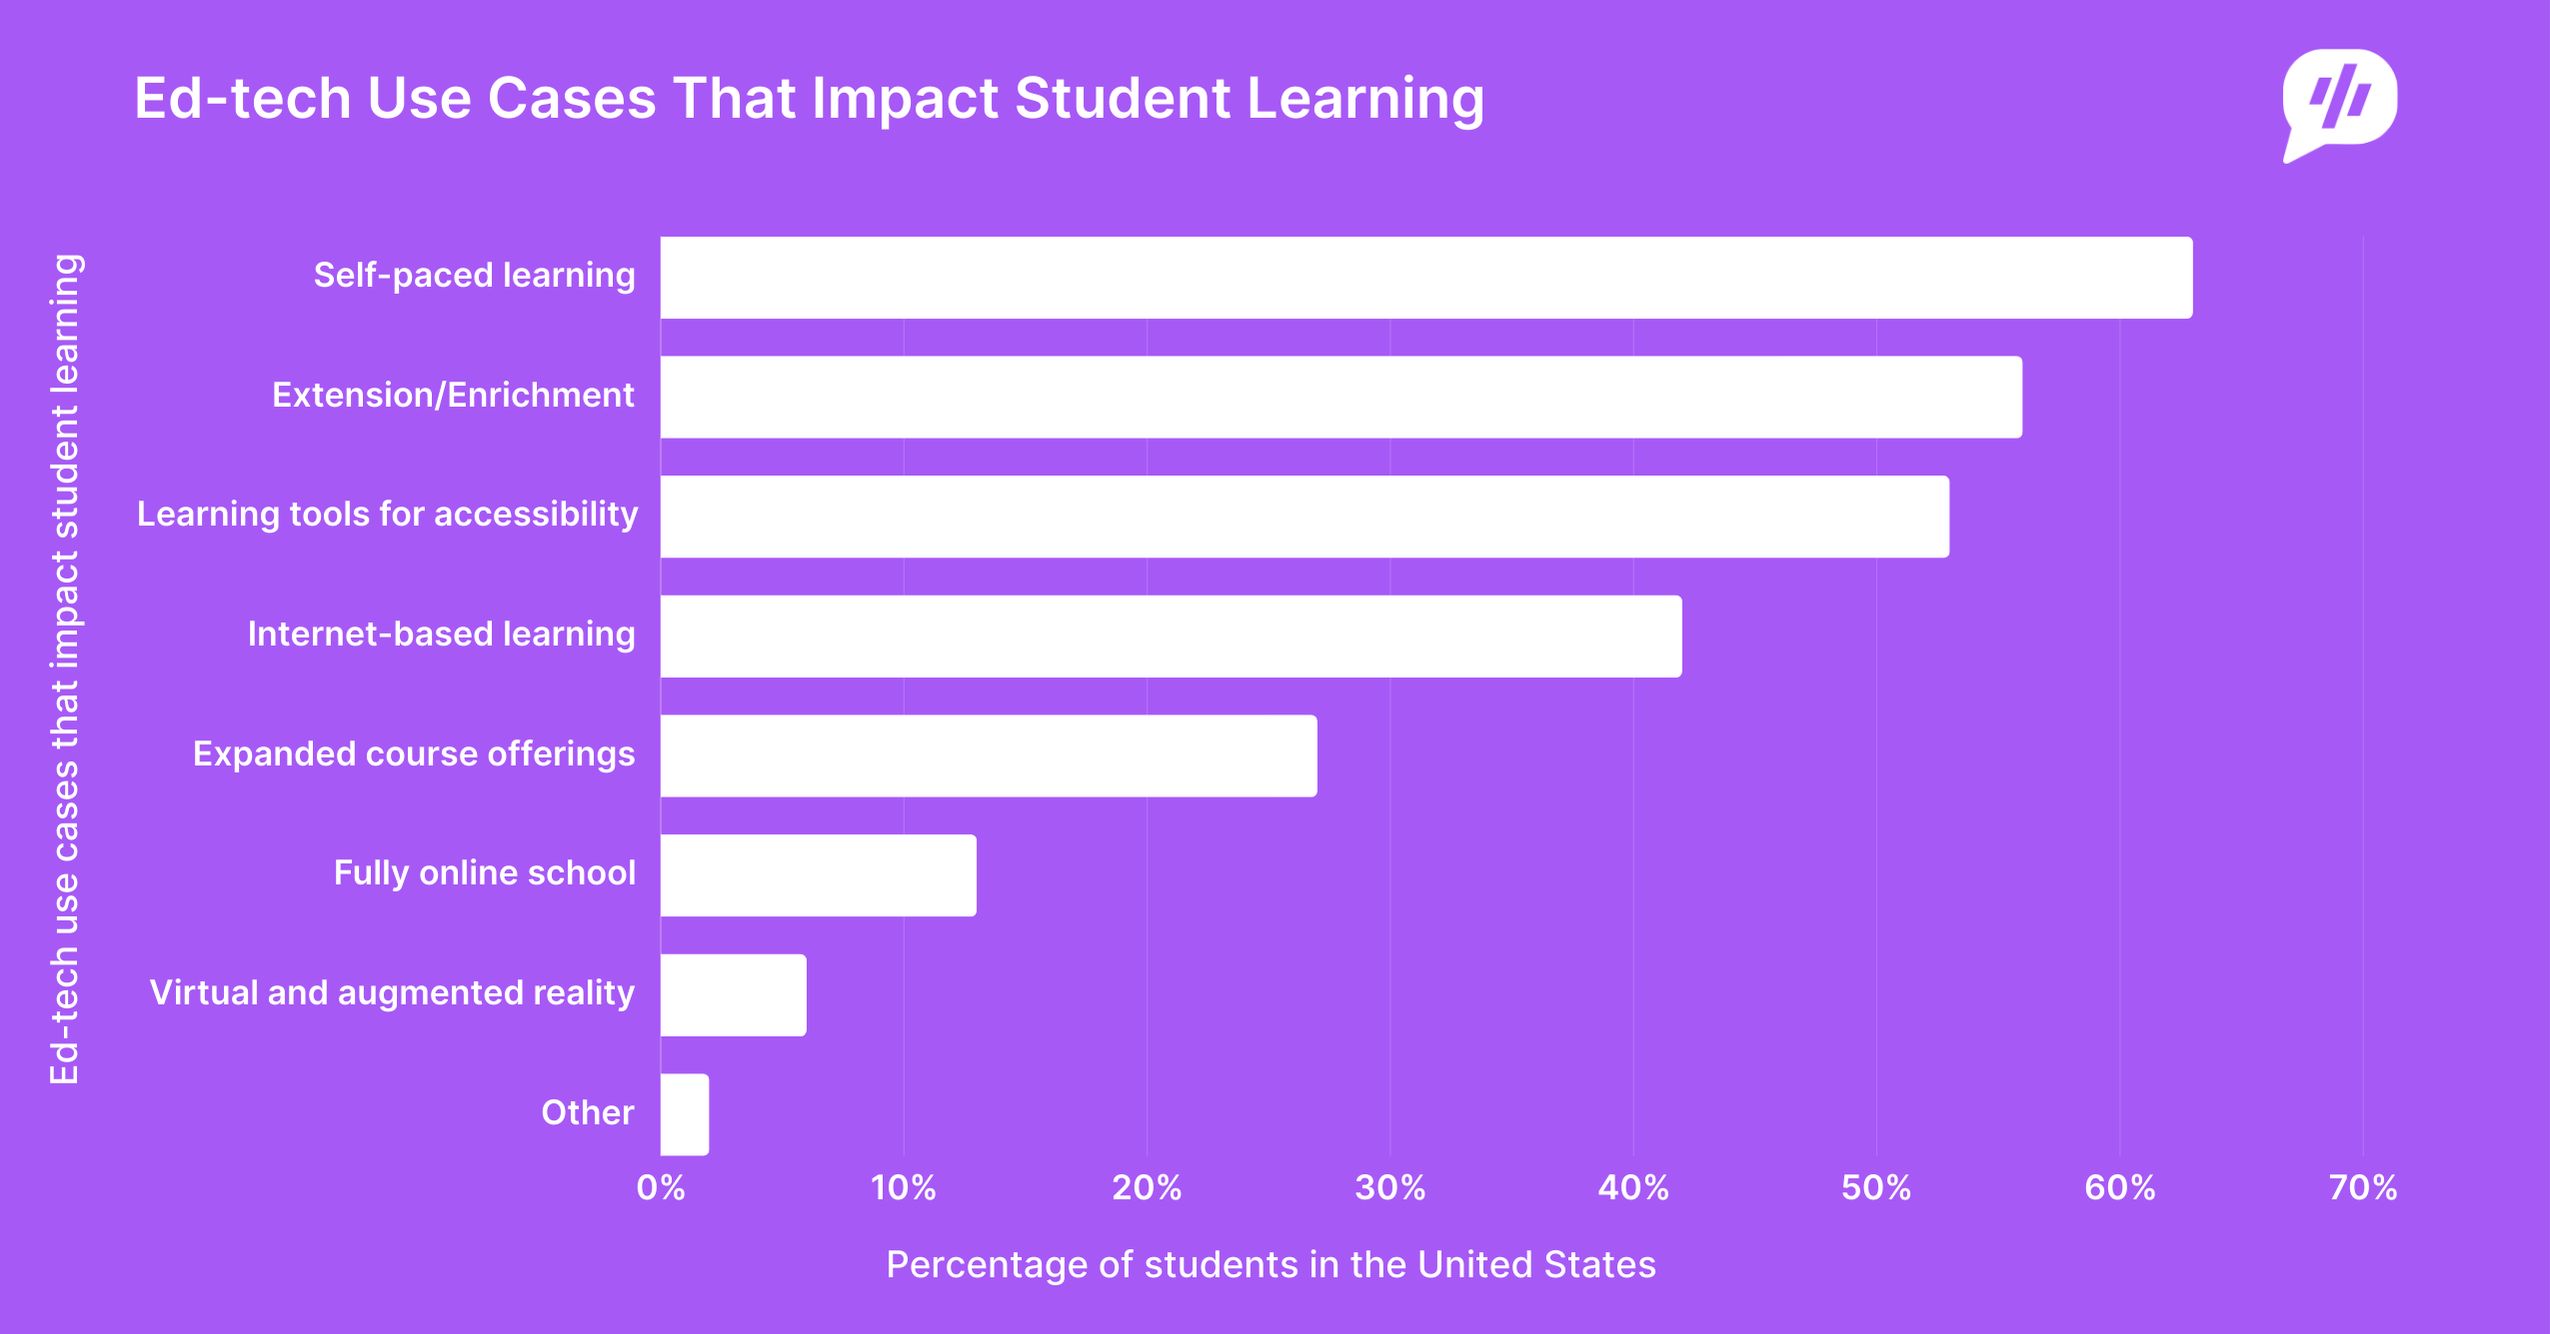
The following table displays the impact of ed-tech on the student learning process through different use cases.
| Ed-tech use cases that impact student learning | Percentage of students in the United States |
|---|---|
| Self-paced learning | 63% |
| Extension/Enrichment | 56% |
| Learning tools for accessibility (e.g., visual, physical, or other) | 53% |
| Internet-based learning | 42% |
| Expanded course offerings | 27% |
| Fully online school | 13% |
| Virtual and augmented reality | 6% |
| Other | 2% |
Source: Statista
16. Google Classroom is the top learning management system used by K-12 students and teachers in the United States as of the academic year 2022- and 2023 in the United States.
Besides, Quizlet was the top study tool used by students in the country, while YouTube was the top referred resource.
The following table displays the most used EdTech solutions in K-12 schools in the United States during the 2022-23 school year.
| Solution purpose | Most used edtech solution |
|---|---|
| Top learning management system | Google classroom |
| Top courseware platform | i-Ready |
| Top supplemental platform | Nearpod |
| Top classroom response and assessment tool | Blooket |
| Top study tool | Quizlet |
| Top site/Resource | YouTube |
Source: Statista.
17. 57% of the students in the United States are more optimistic about online learning than before the pandemic.
Before the pandemic, eLearning was preferred mostly by older adults who were trying to earn degrees or gain additional knowledge while balancing their lives. Now, most students have experienced online learning, which has resulted in a change of opinion, and most students today prefer online learning over traditional learning methods.
Source: Inside Higher Ed
18. On average, the students used 2,591 Edtech tools per K-12 school district in the United States.
That was an increase of 44 used by the students as compared to that recorded in the academic year 2021-2022.
Besides, the number of EdTech tools used increased rapidly by 1,368 tools used per K-12 school district in the academic year 2019-20.
The following table displays the average number of edTech tools used per K-12 school district in the United States over the years.
| Year | The average number of Edtech tools |
|---|---|
| 2022-23 | 2,591 |
| 2021-22 | 2,547 |
| 2020-21 | 2,358 |
| 2019-20 | 2,263 |
| 2018-19 | 895 |
| 2017-18 | 637 |
| 2016-17 | 300 |
Source: Statista
19. 81% of the students stated that online learning helped them improve their grades.
Over 4 in 5 college students stated that eLearning has positively impacted their academic results.
Students can rewatch the lessons and revise the lectures whenever required in online learning. Hence, compared to traditional methods, students are more likely to retain more information while studying online, and as a result, their grades improve.
Source: McGraw Hill
Corporate eLearning Statistics
20. 93% of the businesses worldwide are planning to adopt eLearning in 2025.
Digital Learning has been accepted widely globally.
Around 4 out of 10 times, the firms that have adopted eLearning tend to outperform their counterparts in revenue or other financial teams.
Source: Radixweb
21. 9 in 10 companies offer their employees with some form of digital learning.
The majority of companies have hopped on the eLearning trend and offer their employees different e-learning courses and platforms to upskill their knowledge about the industry.
Executives, people managers, and talent developers agree that learning and development are crucial to the company.
Source: LinkedIn
22. Employees have an 18% higher engagement rates in the companies that use eLearning.
This increase in engagement rates is due to more confident employees. As a result, these employees produce 2.6 times higher earnings per share compared to their competitors.
Source: Delvin Peck.
23. 82% of employees working at enterprises stated that they refer to interactive videos over non-interactive videos.
The major reason for this preference is that interactive videos hook the employees, and they are able to focus better on learning.
72% of the employees stated they cannot fully focus on the eLearning videos. Hence, adding interactive elements to the videos can boost the learning process.
Source: Kaltura.
24. 7 in 10 employees stated that they prefer to learn at work.
Over 70% of the employees stated that they prefer learning at work over learning alone. Conversely, 58% of the employees state that they prefer to learn at their own pace.
Source: LinkedIn
25. Dow Chemical saved $34 million by switching to online training and education.
After adopting online learning, the company dropped its expenses from $95 to $11 per learner/course.
Shifting from in-person training to online training can be a hassle; however, online learning can help cut expenses.
Source: Belitsoft
Mobile eLearning Statistics
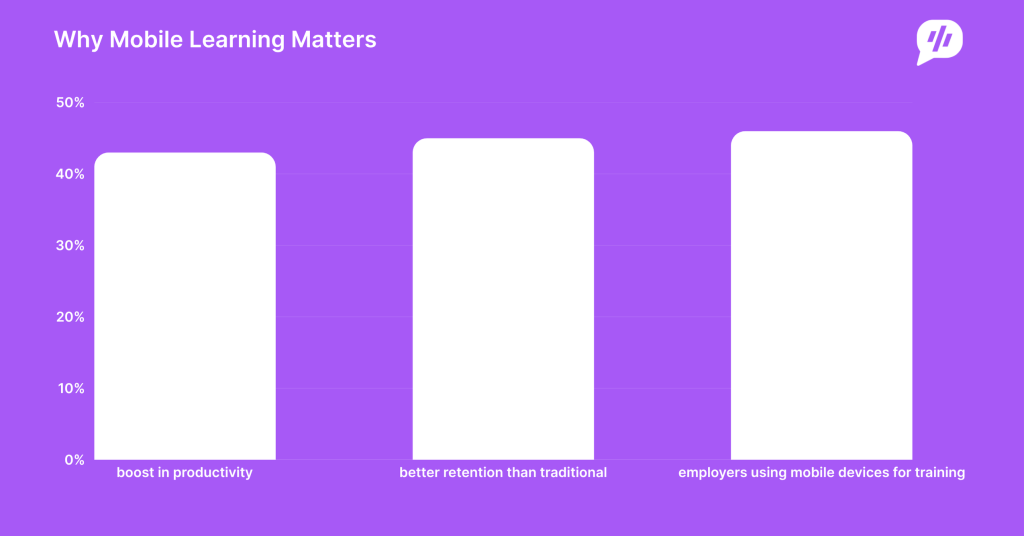
26. Employees who engaged with mobile learning witnessed a productivity boost of 43%.
Mobile learning engages employees in learning through modern delivery mechanisms like microlearning. In this method, the employees can spend 2 to 5 minutes in a lesson, resulting in increased engagement.
As a result, employees can complete their courses 45% faster than their desktop counterparts.
Source: Edu me.
27. Mobile learning helps improve retention rates by 45% more than traditional learning methods.
Compared to traditional learning, mobile learning is more interactive and fun. As a result, mobile learning has improved the results and experiences of students learning online around the globe.
Source: eLearning Industry
28. Nearly 1 in 2 employers utilize mobile devices to provide training to their employees.
Around 46% of businesses utilize mobile devices to offer training and to illustrate the working process.
eLearning, especially mobile learning is gradually taking over traditional training methods of learning and provides easy-to-access training with different adaptable methods.
Source: eLearning Industry
MOOC Statistics
29. The MOOC market worldwide is predicted to reach $22.80 billion in 2025.
The MOOC market is projected to reach $119.17 billion by 2029 after growing at a CAGR of 39.20% between 2024 and 2029.
The MOOC market worldwide is driven by digitalization trends, increased smartphone penetration, easily accessible Internet, and the demand for cost-effective education platforms.
The North American region is estimated to be the largest market worldwide in the forecast period of 2024 to 2028, whereas the Asia Pacific region is expected to be the fastest-growing market worldwide.
Source: Mordor Intelligence.
30. Coursera is the most popular MOOC platform, with 148 million users worldwide.
Coursera recorded 7 million new registered learners in the first quarter of 2024. As a result, the number of Coursera learners grew from $142 million recorded at the end of 2023 to 148 million recorded in the first quarter of 2024.
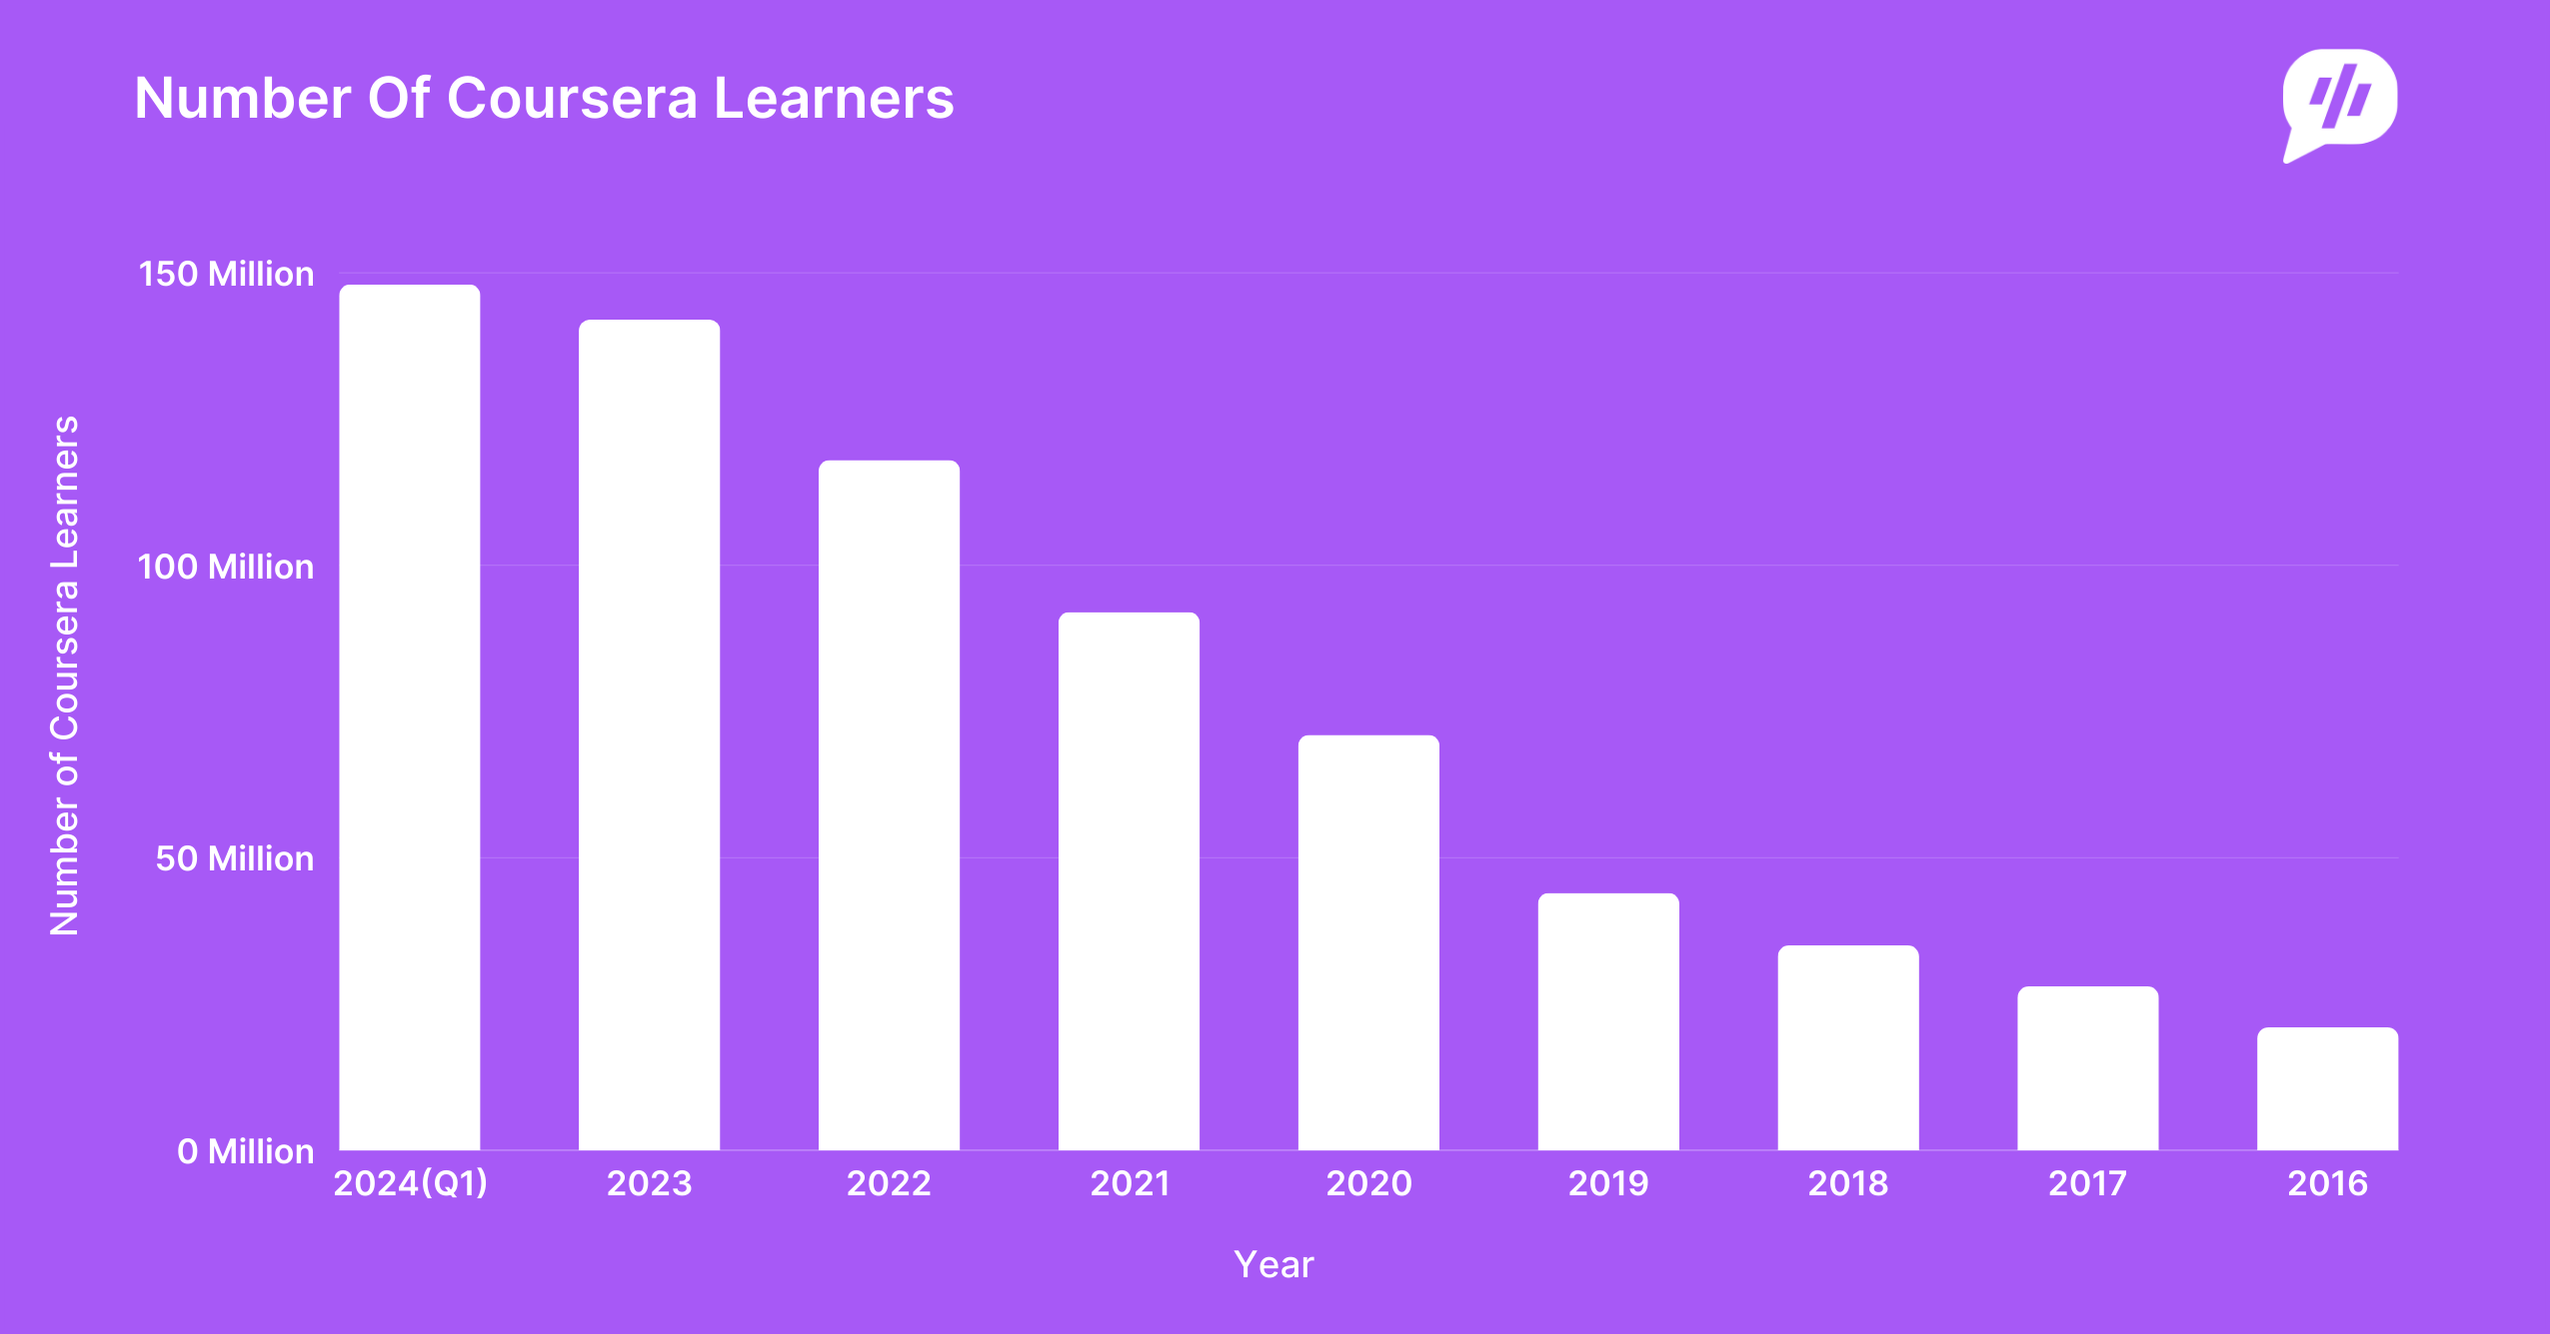
Here is a table displaying the number of Coursera learners recorded over the years.
| Year | Number of Coursera Learners |
|---|---|
| 2024(Q1) | 148 million |
| 2023 | 142 million |
| 2022 | 118 million |
| 2021 | 92 million |
| 2020 | 71 million |
| 2019 | 44 million |
| 2018 | 35 million |
| 2017 | 28 million |
| 2016 | 21 million |
Source: Coursera, Coursera Impact report.
31. Udacity has nearly 17 million users across 240 countries worldwide.
It offers over 80 nano-degree programs, 350 courses, 370 real-world projects, and 2,500 skills.
Furthermore, 73% of graduates reported changing careers after completing a Udacity course.
Source: Udacity.
32. With 160 partners worldwide, EdX offers 300 courses in different fields.
With over 40 million active learners, EdX is one of the most popular MOOC platforms worldwide.
Source: EdX, EdX Impact report.
LMS Statistics
33. 72% of the organization uses a learning management system.
These organizations believed that a learning management system gave the enterprises a competitive advantage over their competitors. The LMS helps in providing employees with the knowledge they require to sustain and upskill in the industry.
Source: eLearning Industry
34. 73.8 million people are estimated to use LMS as of 2025.
Approximately 87% of the active users have web-based LMS programs.
Corporate-level executives and managers make up the primary participants in the learning management programs, accounting for 65% and 35% of the share.
Source: Research.com.
35. The education sector accounts for 21% of the entire global LMS market.
At the same time, real estate and nonprofit organizations both account for 3% of each of the LMS markets.
Meanwhile, other sectors that take up a significant share of the LMS market are:
- Technology: 12%
- Manufacturing: 9%
- Healthcare and consulting: 7%
- Software development companies: 4%
Source: Research.com
Benefits of eLearning
36. Energy consumption has been reduced by 90% due to the adoption of eLearning.
A study highlighted that adopting eLearning leads to 90% less energy consumption than in-class learning.
One university can save around 4000 hours of lightning per classroom. As a result, schools can save thousands of dollars and prevent the emission of around 19 tonnes of CO2.
Source: Luisazhou.
37. Online learning requires 40% to 60% less time than traditional learning.
As a result, eLearning applicants can study five times more material than students learning through traditional methods.
Besides, according to IBM, for every dollar spent on eLearning, the firms could achieve $30 of productivity boost.
Source: Devin Peck, eLearning Industry.
38. eLearning boosts the retention rates of employees by 25% to 60%.
Comparatively, the retention rate recorded in the traditional learning mode is just 8% to 10%.
One major reason for higher retention rates in eLearning is that the learners have control over the learning process and are able to revisit the lessons as needed.
Source: Forbes.
39. 85% of the online learners stated that their distance learning experience was better or at least equally satisfactory than traditional learning.
One of the major reasons for this is that the educational materials are presented through animations, videos, images, graphics, and other media.
As a result, the learner’s engagement increases in online learning, leading to an increase in the learning process.
Source: Evionica.
Challenges of eLearning
40. 18% of the schools believe that teachers are not trained enough to use the eLearning technology.
Almost two-thirds of schools stated that lack of time is the main factor keeping teachers from becoming familiar with new technologies.
Meanwhile, only 34% of the schools stated that they have enough technical support required for technical usage in their school. On the other hand, 14% of the teachers stated that the usage of technology is limited due to other priorities in their schools.
Other challenges for the adoption of eLearning in the classroom are:
- 34% of the schools stated that outdated computers and software are a major challenge.
- 34% of the schools stated that they do not have the required tech support.
Source: NCES, Learnworlds
41. 38% of K12 educators stated that students’ lack of access to Wi-Fi and devices at home is the major challenge in eLearning adoption.
Besides, 36% of the K12 educators stated their concern about the increasing screen time of students as a major challenge, and 28% stated concern about students’ online safety.
Source: NCES, Learnworlds.
42. 24% of the students stated concern about the lack of quality in instruction support and academic support for online learning courses.
Meanwhile, 27% of the students claimed they lacked a basic understanding of computer skills. Plus, 43% of the students consider cultural challenges to be the major obstacle in implementing e-learning.
According to recent findings from elearningstats.education, students using digital tools like grammar checkers see a 20% improvement in writing proficiency. Grammarly stands out with real-time corrections and style suggestions.
Here are some additional challenges faced by the students in the adoption of eLearning:
- 8% of online students said that using new software and technologies for digital learning is more likely to become a problem for students.
- Only 26.4% of the students stated that they can confidently use the eLearning system, while 33.9% stated that they are not prepared to use the system.
- 15% of the students stated concern about the lack of interaction with their friends and professors in eLearning, which can be detrimental to their education.
- 21% of the students are concerned about the unfavorable perception of employers about the degree earned online.
- 32% of the students stated that there are no proper policies and guidelines available to bring effect to the eLearning system.
- 17% of the students complained that their learning program did not support mobile access.
- Only 33% of the classrooms have the devices required for eLearning courses.
- 63% of the districts or schools do not have the funding for educational technology.
Source: Research.com
Conclusion: eLearning is Estimated to Reach a Market Value of $185.20 Billion in 2025!
eLearning isn’t just popular, it’s unstoppable. Between 2000 and 2020, the industry grew by 900%, and by 2026, it’s projected to reach $370 billion globally.
In the U.S., 87.6 million learners will be online by 2029, while India will host over 309 million.
Mobile learning boosts retention by 45%, AI tools are cutting teacher prep time by nearly half, and 93% of businesses now rely on digital learning.
Even Coursera added 7 million users in a single quarter.
As a result, eLearning has witnessed higher adoption rates worldwide in education as well as in the training sector and is set to grow more!